time_filter_map
by Julie Cruz, Rheagan Martin, Jordan Earnest, Lihan (Neil) Zhu
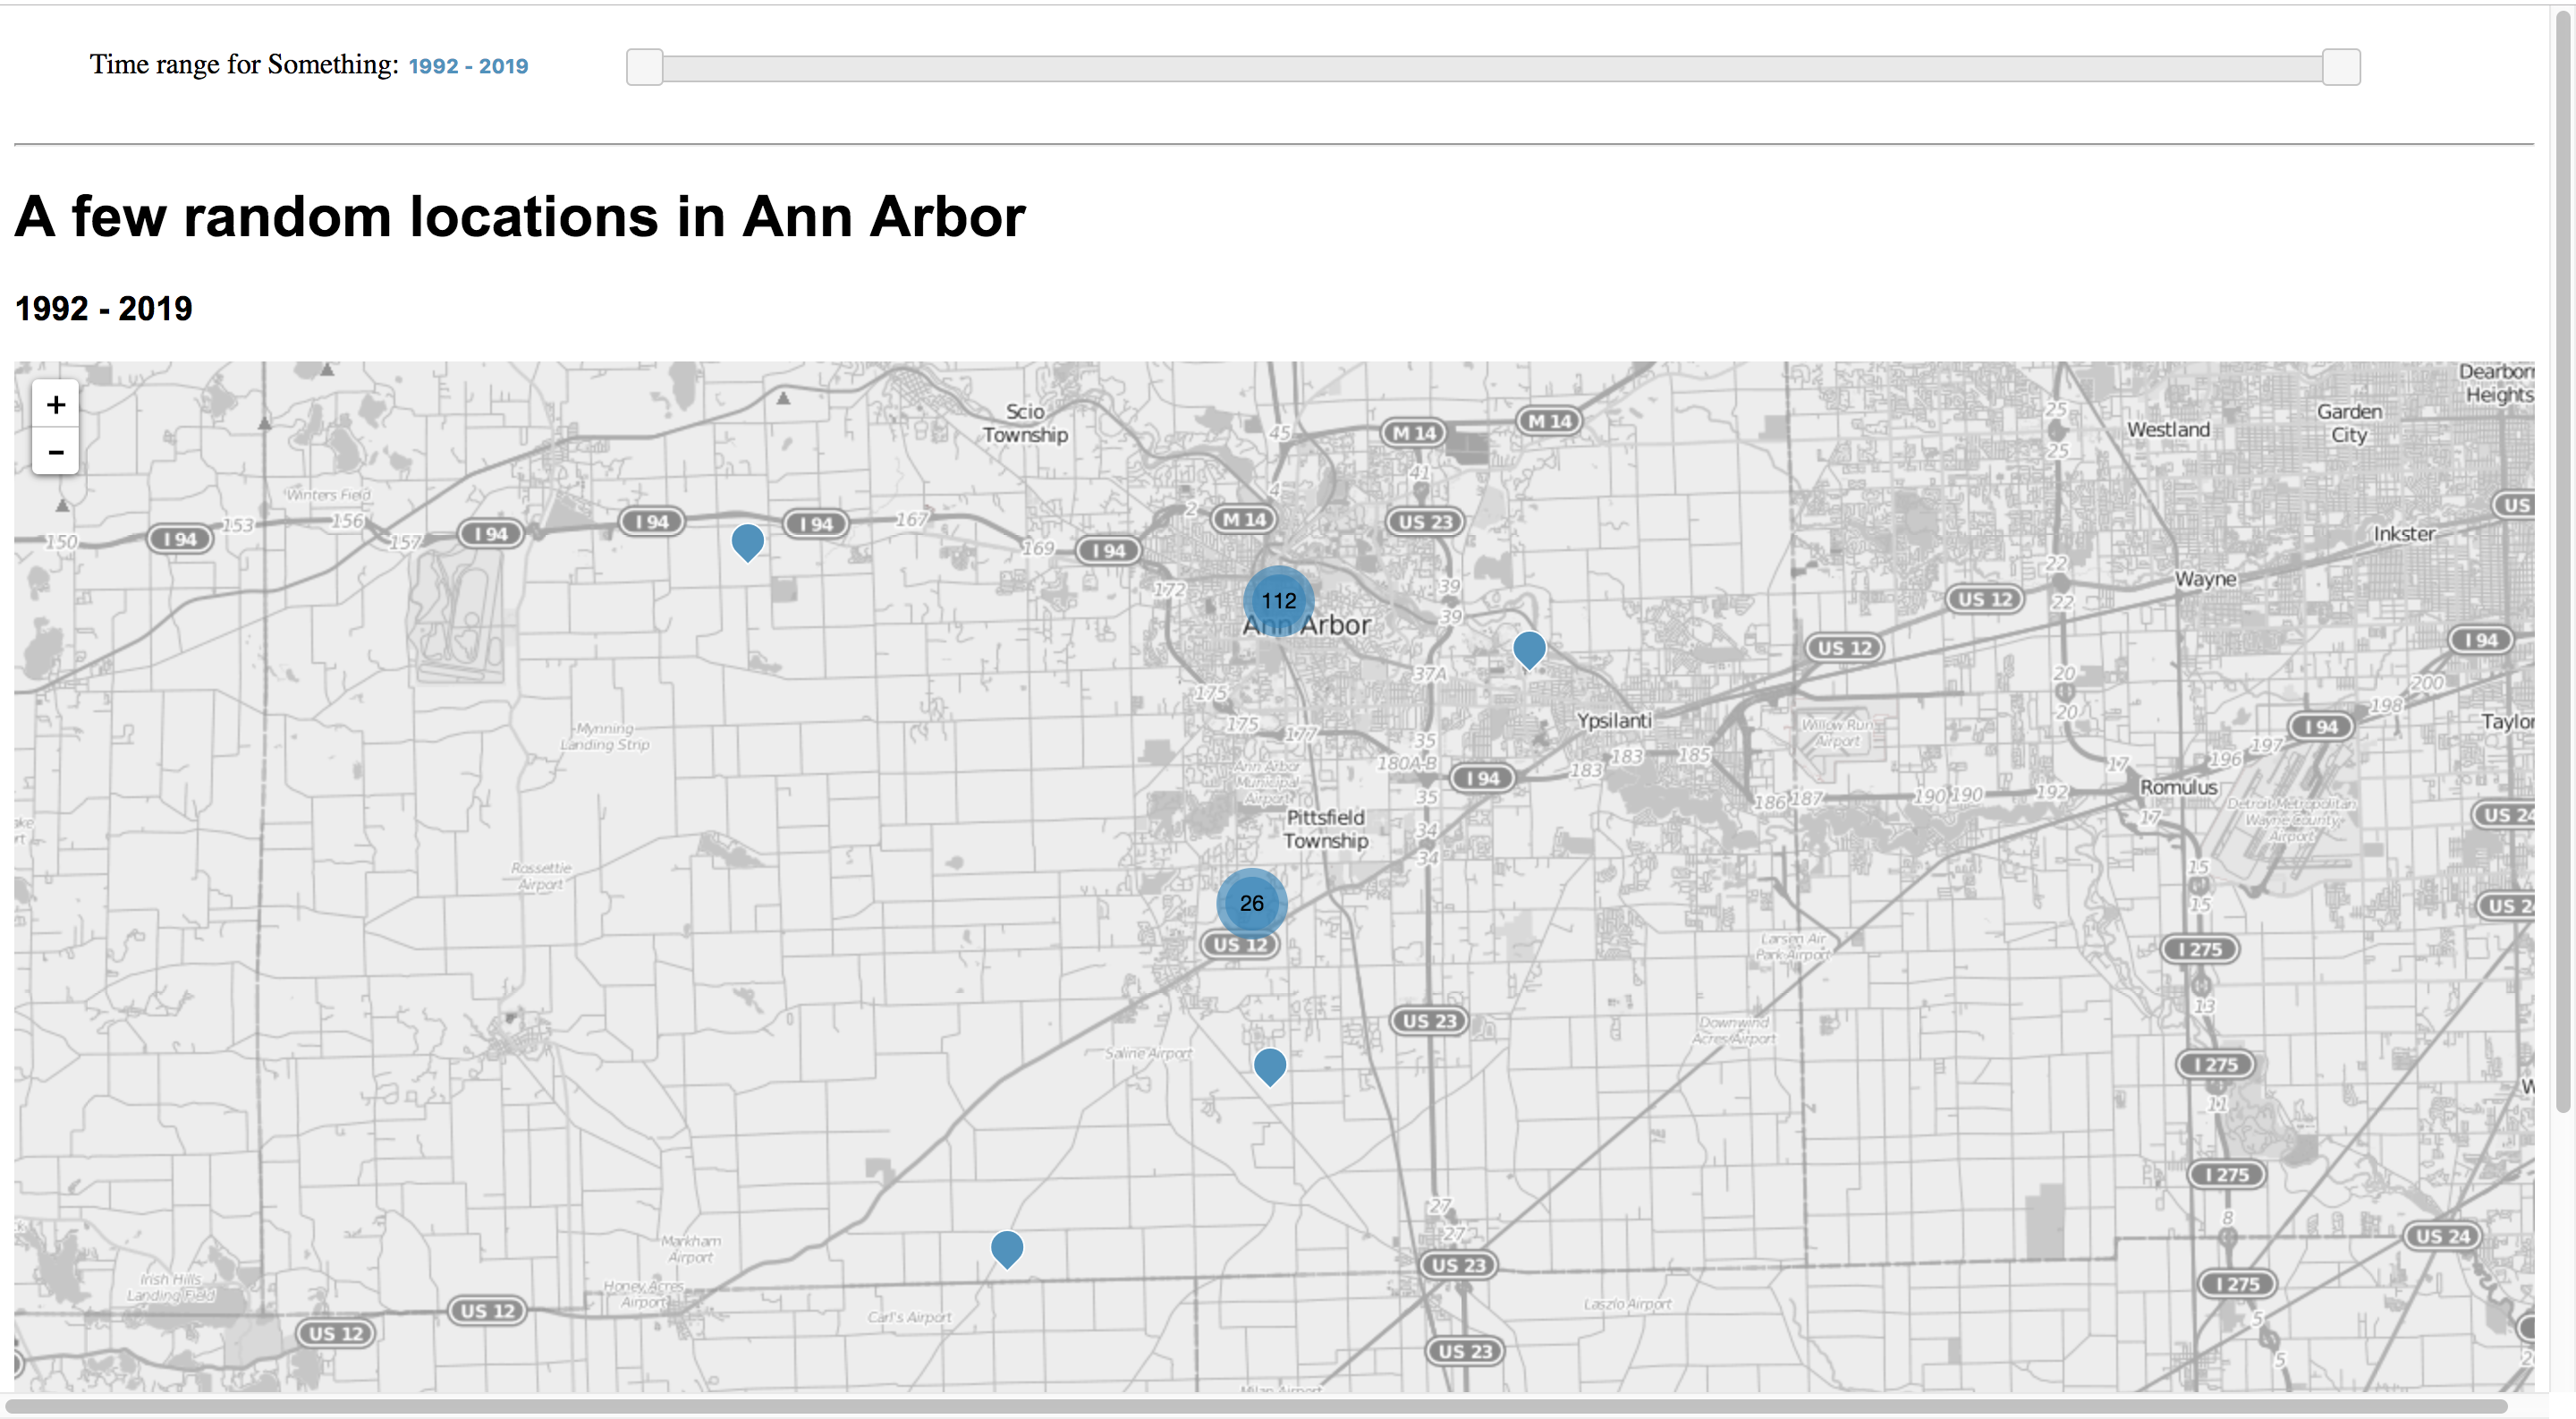
Click the cover image to check how the sample works
Introduction
Our client had data about a group of UMich students’ residential in Ann Arbor for decades, and they wanted the information to be visualized so that the audience have a straight-forward understanding of “How many students lived where and when.”
The client was satisfied with our final outcome. Due to NDA, the original project is not supposed to be shared by us. However, we find its core function, the map with time filter, has a lot of potential for scalability. In addition, although there are existing examples of both Leaflet Map and Range Selector, few of them apply the selector to maps.
Therefore, we have modified the project to share the core function as an handy example, while not showing any confidential information.
Check the Example Map
Following the steps below, you can easily run a map with a time filter on your local server and further customize it as you wish.
Download the Code
Download the Zip file. Unzip the file and you will get a folder named “MapSite” with following folders/files:
- Folder “data”: the data formatted as GEOJSON is inside here.
- Folder “forSlider”: the JS and CSS files needed for the time filter.
- File “index.html”
- File “script.js”
- File “style.css”
Run on the Local Server
Typically, you’d be able to right click on the index.html file and open it with a web browser to render the webpage. If you try this, you’ll likely notice that D3 doesn’t render. This is because we need a server to run D3:
- Open your terminal (Mac) or Command Prompt (Windows).
- Cd into the dir your html is currently in. For example:
cd Desktop/MapSite - Enter:
python -m SimpleHTTPServer 8000orpython3 -m http.server
Now you're ready to render the HTML files. Click on local host to have a look.
Customize for Your Data
1. Prepare Your GEOJSON File
The sample project works for datasets with information about Latitude/Longitude and year (in stringified integer format). The sample dataset looks like:
{
  "type": "FeatureCollection",
  "features":[
    {
      "type": "Feature",
      // All informational data needed other than coordinates
      "properties": {
        "Date": "1992", // associate with the slider
        "address": "2nd St.", // associate with tooltips
        "Count": "1" // associate with mark clusters and tooltips
      },
      // Keep the data of lat/lon here
      "geometry": {
        "type": "Point",
        "coordinates": [-83.755607,42.275139]
      }
    },
    ...
  ]
}
The most important thing here is the information about “coordinates”, under “geometry”. But be sure to have any other needed information inside “properties”. There are many useful resources like this intuitive “GEOJSON generator” that can easily translate your data into GEOJSON.
When the GEOJSON file is done, put it in the “data” folder.
2. Updates in HTML
There are a few places in the file “index.html” you may want to modify:
2.1 Head Title
Starting at Line 12 in the sample code.
<head>
  ...
  <title>Time-filter Map</title>
  ...
</head>
2.2 Time Range Slider Label
Starting at Line 44 in the sample code.
    <div class="sliderDiv" >
        <p>
            <label for="amount">Time range for Something:</label>
            ...
        </p>
        ...
    </div>
2.3 Title
Starting at Line 55 in the sample code.
    <h1>A few random locations in Ann Arbor</h1>
    <h3>1992 - 2019</h3>
3. Updates in JS
There are some critical parameters can be modified in file “script.js”.
3.1 Basic Parameters
Starting at the begining of the sample code.
// Set the parameters
    // The Geojson data you have in your folder
        const geoJsonURL = "data/geoData.geojson";

    // Initial center of the map in terms of longitude and latitude
        const geoCenter = [42.15, -83.7436];

    // Determine initial range of area shown on map (zooms closer when the number is higher)
        const zoomLevel = 11;

    // Start and End year of the dataset
        const baseStartYear = 1992;
        const baseEndYear = 2019;

    //Markers & Clusters
        // The color of the markers, used in function customizeMarker()
            const markColor = '#4E91BE';
        // Determine the threshold of distance that cluster multiple markers, used in Function initialMarkerClusters()
            const maxClusterRadius = 120;
        // Specify the color of the marker cluster in css under the class name, used in Function initialMarkerClusters()
            const clusterColorClass = 'marker-cluster-color';
3.2 Popup(Tooltip) Setup
Starting at Line 173 in the sample code.
...
onEachFeature: function(feature,layer){
                                        layer.bindPopup(
                                            "<b>Address:  </b>" + feature.properties.address + "<br>" +
                                            "<b>No. of Students:  </b>" + feature.properties.Count);
                                        },
...