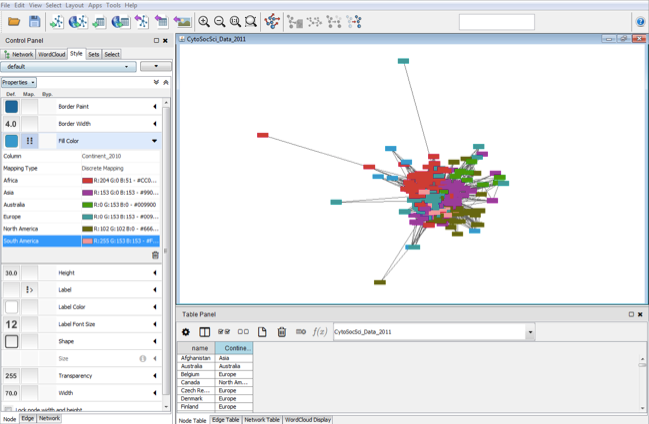
This workshop introduces Cytoscape, an open source network visualization and analysis software package. We will use 2010 migration data from the World Bank’s “Global Bilateral Migration Database,” and focuses on creating a network (graph) with countries represented as nodes, and number of immigrants represented as links (edges) between nodes. Techniques covered include important, viewing, and representing node attribute and edge attribute data, exporting the network graph, creating a legend, filtering data, and more.
You can view the workshop instructions, presentation, and tutorial data in the Github repository.